We are proud to have achieved a 7.13% reduction in year-on-year carbon emissions (versus 2023-24) across our UK operations, especially as a modest scope increase for paper usage (see below) was included for the first time.
This success can be attributed to a range of factors from the reduction in the use of air freighting through to the improved quality of reporting that more accurately allows for the assessment of CO2 emissions.
As standard, all emissions that have not been produced using verified green methods (e.g. renewables) have been offset.
Harmonious coexistence is the underlying foundation of all our business activities. We do business based on this concept and as a philosophy it’s integral to building a sustainable future. Our continued strive for industry leading reporting emphasises our dedication towards the environment.
Further to the increase in scope 3 emissions reported in 2022-23, we continue to broaden the range we measure, to include:
These are calculated in accordance with the Greenhouse Gas (GHG) protocol and UK GHG reporting conversion factors.
It is important to highlight difficulties within supply chain for obtaining accurate CO2 emissions relating to services provided to their UK operations that may hamper identification of and subsequent offsetting of scope 3 emissions.

2019-20 remains the baseline for emissions we assess against alongside the year-on-year changes from 2022-23.
The baseline is a record of historic greenhouse gas emissions that have been produced in the past prior to the introduction of any strategies to reduce emissions. These act as a reference point against which emissions reduction can be measured.
Both the baseline and our target emissions are those produced by our UK operations. They include Scope 1 and 2 categories. As indicated above, the only Scope 3 emissions included in both the baseline year and 2022-23 are those for company travel.
Baseline emissions
| Emissions | Total (tCO2e) |
|---|---|
| Scope 1 | 1,072 |
| Scope 2 | 194 |
| Scope 3 (previous scoping) * | 230 |
| Total emissions* | 1,495 |
Note: First year of reporting under SECR standard with full data set.
Baseline emissions
| Emissions | Total (tCO2e) |
|---|---|
| Scope 1 | 685 |
| Scope 2 | 102 |
| Scope 3 | 587 |
| Total emissions* | 1,374 |
| % Emissions offset* | 100% |
| Remaining emissions* | 0 |
Current Emissions Reporting
| Emissions | Total (tCO2e) | Versus 2022-23 | Versus Baseline (2019-20) | ||
|---|---|---|---|---|---|
| Scope 1 | 626 | 685 | ↓8.6% | 1,072 | ↓41.6% |
| Scope 2 | 111 | 102 | ↑8.8% | 194 | ↓42.8% |
| Scope 3 | 539 | 587 | ↓8.5% | 230* | ↑134.3% |
| Total emissions | 1,276 | 1,374 | ↓7.1% | 1,495 | ↓14.6%% |
| % Emissions offset | 100% | 100% | |||
| Remaining emissionst | 0 | 0 | |||
* Previous scope 3 covered transport fuel use from non-company cars

The 2023-24 results show a significant reduction of 41.8%
from 1,266 to 737 tCO2e in scope 1 & 2 against the 2019-20
baseline.
This 529 tCO2e decrease is attributable to several factors,
including:
Scope 1 emissions decreased by 8.6% or 59 tCo2e,
attributable to the closure of our Manchester satellite office
and a conscious effort to reduce gas consumption.
A corresponding 8.8% uplift in scope 2 emissions,
equivalent to a rise of just 9 tCO2e is due to increased
mobility and the promotion of face-to-face meetings with
stakeholders – customers and suppliers – to foster better
engagement in a post-COVID world.
The overall decrease of 50 tCO2e across scope 1 & 2 is
a positive sign towards the organic reduction of carbon
emissions.
There is little value in reviewing this year’s scope 3 emissions against the baseline which allows us to assess against changes in Scope 1 & 2 emissions, when:
This is the first year we can make a like-for-like comparison of our more extensive range of scope 3 emissions (see page
4 above).
The 2023-24 results show an 8.2% reduction in scope 3
emissions even with a minor increase in scope to include
company-wide paper usage.
Contributary factors include:
Outside of commuting, the largest contributory category
(26.8%) for scope 3 emissions remains transportation and
distribution (upstream and downstream) of our hardware
and consumable products. This saw an increase of 12.5
tCO2e in 2023-24 due to increased freighting as logistical limitations experienced in 2022-23 resolved.
In line with SECR reporting, reported scope 1 and 2 emissions are broken down into three categories:
• Combustion of gas within our sites (Scope 1).
• Combustion of fuel for transport – e.g. using company vehicles etc (Scope 1).
• Use of purchased electricity (Scope 2).
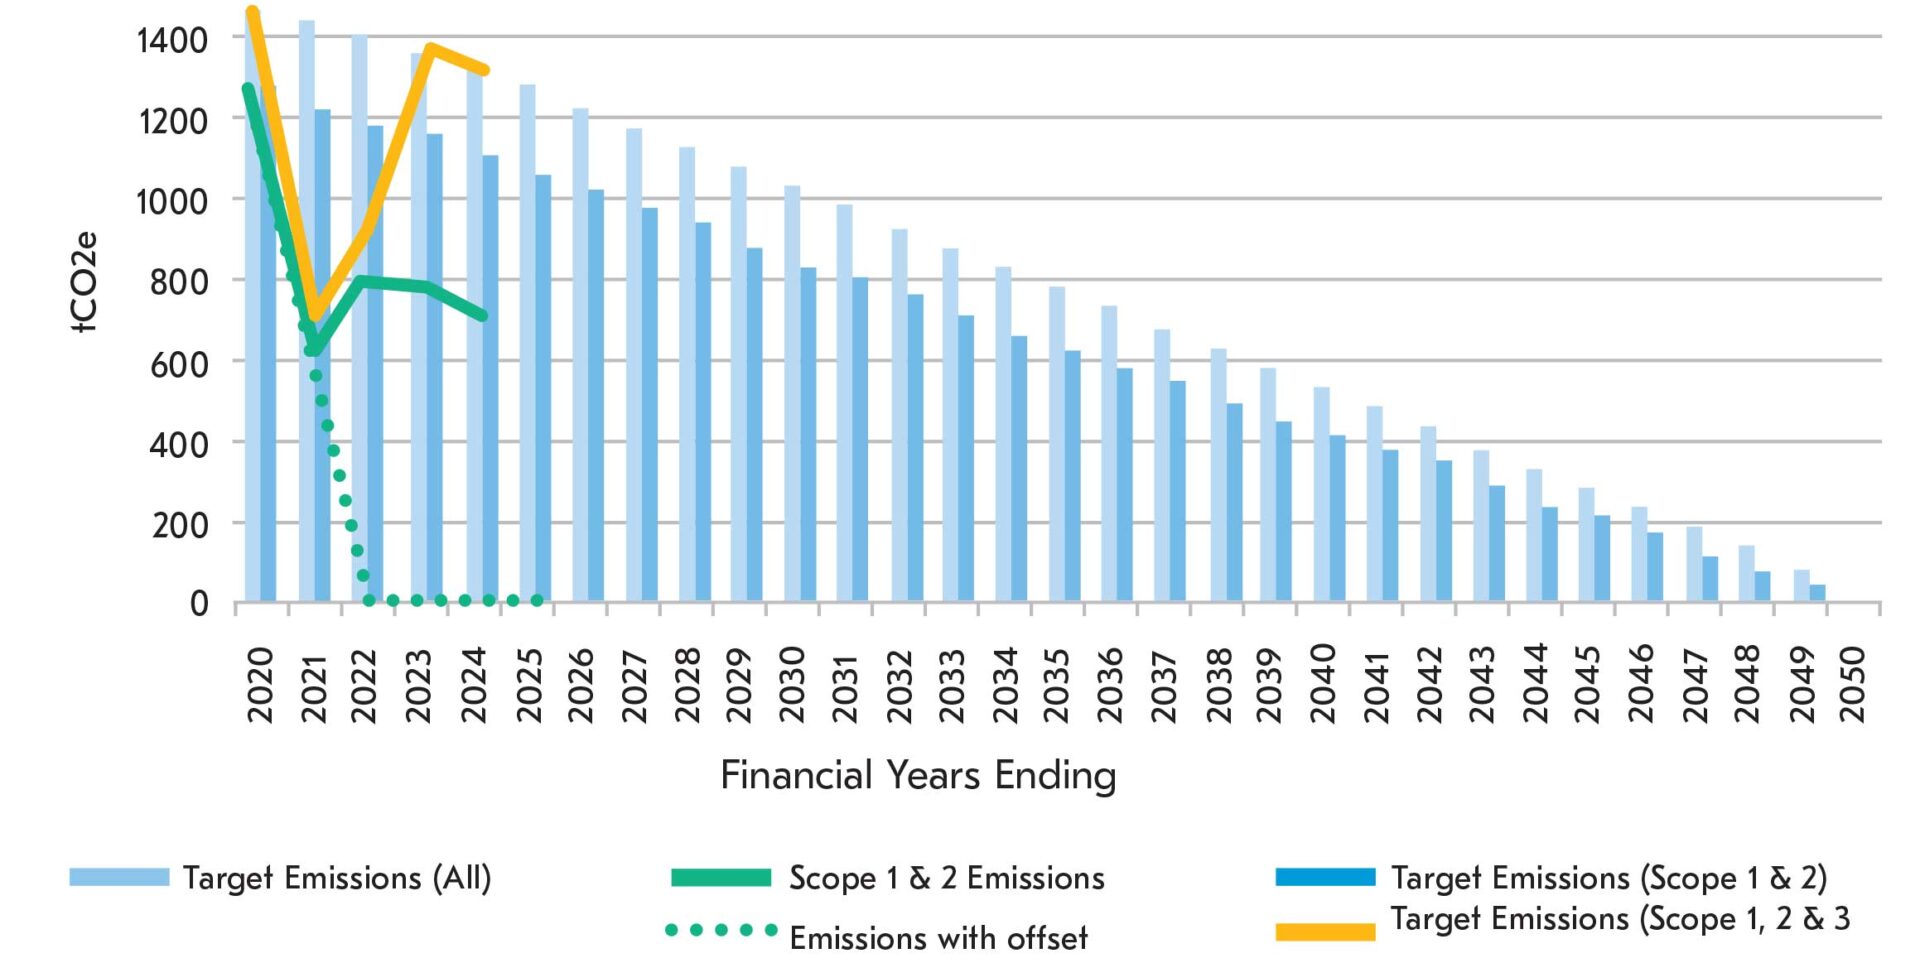
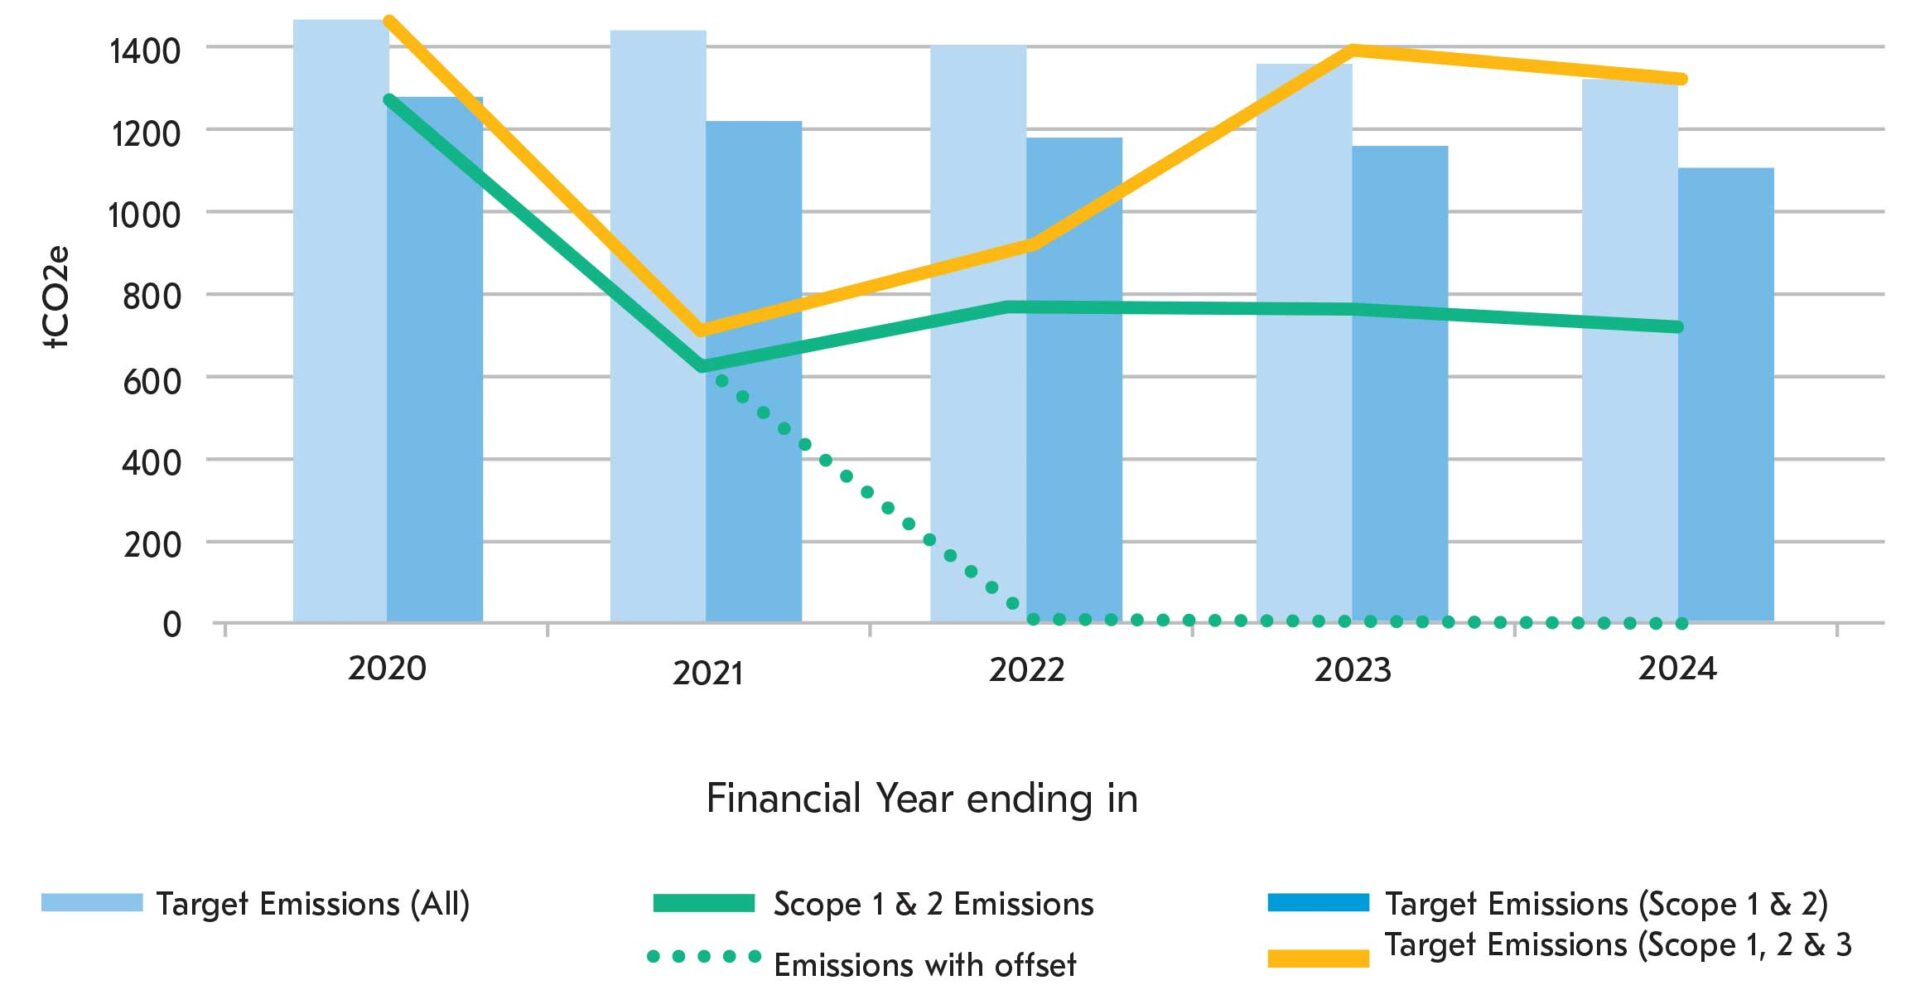
The graph shows a linear target reduction for achieving net zero by 2050 (blue bars) which includes scope 1 & 2 as well as “all scope” targets (yellow line).
Progress towards net zero is demonstrated by the lines
plotted in green showing actual emissions since the 2019-20 baseline.
In 2022 we made a commitment to offset the entirety of our operational emissions each year, as measured by the SECR
standard by investing in carbon-reduction projects certified to international standards. This allowed us to be carbon neutral from 2022 onwards (green line) 28 years ahead of plan.
During 2020-21 and a portion of 2021-22 emissions were
impacted by pandemic related temporary changes to our
business operations, resulting in significant reductions in
employee travel due to lockdowns and building occupancy as staff worked from home.
An increase in emissions produced during 2021-22 is evident as travel increased and customer activity returned to
normal.
The increase in emissions in 2022-23 shown in both graphs
highlights the expansion of scope 3 reporting and reflects
our ongoing commitment to true best-in-class carbon
reduction.

The graph shows that even with the expanded reported
scope 3 emissions versus the baseline year, we are under
the target set versus the old scoping, with a goal of becoming organically “Net Zero” by 2050, without need for offsetting.
Point 1 below indicates the baseline of 2019-20 as the starting point when modelling commenced. Point 2, from 2022 onwards, demonstrates the commitment made to offset the entirety of our UK operation’s emissions each year to SECR standards.
Both graphs shows scope 1 & 2 emissions are well below target levels for 2023-24 (67.2%) and are tracking towards target levels for 2032.
This is a testament to the commitment made by the Kyocera Document Solutions UK Group to reducing our carbon emissions and negative impact on the environment.

Many environmental management measures and projects have been completed or implemented since the 2020 baseline.
All these measures are managed under our ISO 14001 certified environmental management system.

Consolidated toner recycling to a single UK provider with a zero waste to landfill commitment to limit transport emissions, meaning customers can request the collection of empties under Kyocera’s Toner Take Back programme.
New energy efficient HVAC installed at our Reading HQ, replacing an archaic heating and cooling system, which was a major source of electricity usage and carbon emissions for Kyocera Document Solutions Group UK. The benefits of this change will be notable in 2025-26.
Supplier Code of Conducts have been implemented for the Kyocera Document Solutions UK Group supply chain, ensuring that, to the greatest extent possible, suppliers will assist by providing information on carbon emissions, and actively look to limit this within their own supplier operations.
An electric car salary sacrifice scheme was launched in line with the UK government initiative.
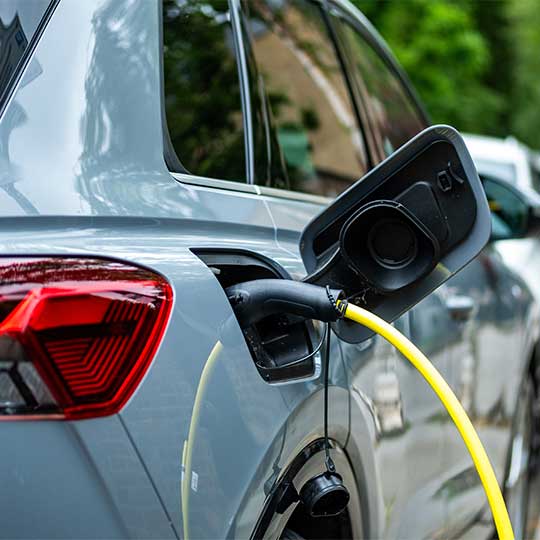
Solar powered electric vehicle charging infrastructure installed at Pershore office.
We reforested the 376,000 pages we printed as a business. As part of the inclusion within this report and per our prior practice paper usage is subject to offset through reforesting.
Working with key suppliers to improve access to and the veracity of carbon emissions data relating to goods and / or services provided to the Kyocera Document Solutions UK Group.
Improving current fleet efficiency and emissions following a review of the company carpool undertaken during 2024-25.
We are looking to expand use of solar panels within the business, leveraging Kyocera’s panel manufacturing capabilities.
Engaging third-parties to support our emissions data veracity and drive further potential improvements.

We are proud to have achieved a 7.13% reduction in year-on-year carbon emissions (versus 2023-24) across our UK operations, especially as a modest scope increase for paper usage (see below) was included for the first time.
This success can be attributed to a range of factors from the reduction in the use of air freighting through to the improved quality of reporting that more accurately allows for the assessment of CO2 emissions.
As standard, all emissions that have not been produced using verified green methods (e.g. renewables) have been offset.
Harmonious coexistence is the underlying foundation of all our business activities. We do business based on this concept and as a philosophy it’s integral to building a sustainable future. Our continued strive for industry leading reporting emphasises our dedication towards the environment.
Further to the increase in scope 3 emissions reported in 2022-23, we continue to broaden the range we measure, to include:
These are calculated in accordance with the Greenhouse Gas (GHG) protocol and UK GHG reporting conversion factors.
It is important to highlight difficulties within supply chain for obtaining accurate CO2 emissions relating to services provided to their UK operations that may hamper identification of and subsequent offsetting of scope 3 emissions.
2019-20 remains the baseline for emissions we assess against alongside the year-on-year changes from 2022-23.
The baseline is a record of historic greenhouse gas emissions that have been produced in the past prior to the introduction of any strategies to reduce emissions. These act as a reference point against which emissions reduction can be measured.
Both the baseline and our target emissions are those produced by our UK operations. They include Scope 1 and 2 categories. As indicated above, the only Scope 3 emissions included in both the baseline year and 2022-23 are those for company travel.
Baseline emissions
| Emissions | Total (tCO2e) |
|---|---|
| Scope 1 | 1,072 |
| Scope 2 | 194 |
| Scope 3 (previous scoping) * | 230 |
| Total emissions* | 1,495 |
Note: First year of reporting under SECR standard with full data set.
Baseline emissions
| Emissions | Total (tCO2e) |
|---|---|
| Scope 1 | 685 |
| Scope 2 | 102 |
| Scope 3 | 587 |
| Total emissions* | 1,374 |
| % Emissions offset* | 100% |
| Remaining emissions* | 0 |
Current Emissions Reporting
| Emissions | Total (tCO2e) | Versus 2022-23 | Versus Baseline (2019-20) | ||
|---|---|---|---|---|---|
| Scope 1 | 626 | 685 | ↓8.6% | 1,072 | ↓41.6% |
| Scope 2 | 111 | 102 | ↑8.8% | 194 | ↓42.8% |
| Scope 3 | 539 | 587 | ↓8.5% | 230* | ↑134.3% |
| Total emissions | 1,276 | 1,374 | ↓7.1% | 1,495 | ↓14.6%% |
| % Emissions offset | 100% | 100% | |||
| Remaining emissionst | 0 | 0 | |||
* Previous scope 3 covered transport fuel use from non-company cars

The 2023-24 results show a significant reduction of 41.8%
from 1,266 to 737 tCO2e in scope 1 & 2 against the 2019-20
baseline.
This 529 tCO2e decrease is attributable to several factors,
including:
Scope 1 emissions decreased by 8.6% or 59 tCo2e,
attributable to the closure of our Manchester satellite office
and a conscious effort to reduce gas consumption.
A corresponding 8.8% uplift in scope 2 emissions,
equivalent to a rise of just 9 tCO2e is due to increased
mobility and the promotion of face-to-face meetings with
stakeholders – customers and suppliers – to foster better
engagement in a post-COVID world.
The overall decrease of 50 tCO2e across scope 1 & 2 is
a positive sign towards the organic reduction of carbon
emissions.
There is little value in reviewing this year’s scope 3 emissions against the baseline which allows us to assess against changes in Scope 1 & 2 emissions, when:
This is the first year we can make a like-for-like comparison of our more extensive range of scope 3 emissions (see page
4 above).
The 2023-24 results show an 8.2% reduction in scope 3
emissions even with a minor increase in scope to include
company-wide paper usage.
Contributary factors include:
Outside of commuting, the largest contributory category
(26.8%) for scope 3 emissions remains transportation and
distribution (upstream and downstream) of our hardware
and consumable products. This saw an increase of 12.5
tCO2e in 2023-24 due to increased freighting as logistical limitations experienced in 2022-23 resolved.
In line with SECR reporting, reported scope 1 and 2 emissions are broken down into three categories:
• Combustion of gas within our sites (Scope 1).
• Combustion of fuel for transport – e.g. using company vehicles etc (Scope 1).
• Use of purchased electricity (Scope 2).
The graph shows a linear target reduction for achieving net zero by 2050 (blue bars) which includes scope 1 & 2 as well as “all scope” targets (yellow line).
Progress towards net zero is demonstrated by the lines
plotted in green showing actual emissions since the 2019-20 baseline.
In 2022 we made a commitment to offset the entirety of our operational emissions each year, as measured by the SECR
standard by investing in carbon-reduction projects certified to international standards. This allowed us to be carbon neutral from 2022 onwards (green line) 28 years ahead of plan.
During 2020-21 and a portion of 2021-22 emissions were
impacted by pandemic related temporary changes to our
business operations, resulting in significant reductions in
employee travel due to lockdowns and building occupancy as staff worked from home.
An increase in emissions produced during 2021-22 is evident as travel increased and customer activity returned to
normal.
The increase in emissions in 2022-23 shown in both graphs
highlights the expansion of scope 3 reporting and reflects
our ongoing commitment to true best-in-class carbon
reduction.

The graph shows that even with the expanded reported
scope 3 emissions versus the baseline year, we are under
the target set versus the old scoping, with a goal of becoming organically “Net Zero” by 2050, without need for offsetting.
Point 1 below indicates the baseline of 2019-20 as the starting point when modelling commenced. Point 2, from 2022 onwards, demonstrates the commitment made to offset the entirety of our UK operation’s emissions each year to SECR standards.
Both graphs shows scope 1 & 2 emissions are well below target levels for 2023-24 (67.2%) and are tracking towards target levels for 2032.
This is a testament to the commitment made by the Kyocera Document Solutions UK Group to reducing our carbon emissions and negative impact on the environment.

Many environmental management measures and projects have been completed or implemented since the 2020 baseline.
All these measures are managed under our ISO 14001 certified environmental management system.

Consolidated toner recycling to a single UK provider with a zero waste to landfill commitment to limit transport emissions, meaning customers can request the collection of empties under Kyocera’s Toner Take Back programme.
New energy efficient HVAC installed at our Reading HQ, replacing an archaic heating and cooling system, which was a major source of electricity usage and carbon emissions for Kyocera Document Solutions Group UK. The benefits of this change will be notable in 2025-26.
Supplier Code of Conducts have been implemented for the Kyocera Document Solutions UK Group supply chain, ensuring that, to the greatest extent possible, suppliers will assist by providing information on carbon emissions, and actively look to limit this within their own supplier operations.
An electric car salary sacrifice scheme was launched in line with the UK government initiative.
Solar powered electric vehicle charging infrastructure installed at Pershore office.
We reforested the 376,000 pages we printed as a business. As part of the inclusion within this report and per our prior practice paper usage is subject to offset through reforesting.
Working with key suppliers to improve access to and the veracity of carbon emissions data relating to goods and / or services provided to the Kyocera Document Solutions UK Group.
Improving current fleet efficiency and emissions following a review of the company carpool undertaken during 2024-25.
We are looking to expand use of solar panels within the business, leveraging Kyocera’s panel manufacturing capabilities.
Engaging third-parties to support our emissions data veracity and drive further potential improvements.
